Goals of segmentation
- Group together similar-looking pixels for efficiency of further processing
> simplify and / or change the representation of a image into something that is more meaningful and easier to analyze
Major processes for segmenation
- Separate image into coherent 'object'
> Bottom-up : group tokens with similar features
> Top-down : group tokens that likely belong to the same object
> Supervised or unsupervised
Segmentation using clustering
- K-means
- Mean-shift
Feature Space
- Cluster similar pixels (features ) together
Segmentation as clustering
- Cluster together tokens with high similarity (small distance in feature space)
- Questions
> How many cluster?
> Witch data belongs to which group?
K-means algorithm
- $\text{argmin}_{S,\mu_i, i=1\cdots K} \sum_{i=1}^K \sum_{x\in S_i} ||x - \mu_i||^2$
- Partition the data into K sets $S = {S_1, S_2, \cdots, S_K}$ with corresponding centers $\mu_i$
- Partition such tha tvariance in each partition is as low as possible
----
- Assign each of the N points, $x_j$, to clusters by nearest $\mu_i$
- Re-compute mean $\mu_i$ of each cluster from its member points
- if no mean has changed more than some $\epsilon$, stop
- solving the optimization problem $\text{argmin}_s \sum_{i=1}^k \sum_{x_j \in S_i} ||x_j - \mu_i||^2$ <- $e(\mu_i)$
- Every iteration is a step of gradient descent. $\frac{\partial e}{\partial \mu_i} = 0$, $\mu_i^{t+1} = \frac{1}{|S_t^{(t)}|}\sum_{x_j \in S_i^{i}} x_j $
----
- an iterative technique that is used to partition an image into K clusters
> Pick K cluster centers, either randomly or based on some heuristic
> Assign each pixel in the image to the cluster that minimizes that distance between the pixel and the cluster center
> Re-compute the cluster centers by averaging all of the pixels in the cluster
> Repeat steps 2 and 3 until convergence in attained (i.e. no pixels change clusters)
- distance : the squared or absolute differnce between a pixel and a cluster center ex) pixel color, intensity, texture and location, or a weighted combination of these factors
- K can be selected manually, randomly, or by a heuristic
- The quality of the solution depends on the initial set of clusters and the value of K
Common similarity / distance measures
- P-norms
- Mahalanobis $d(\vec{x}, \vec{y}) = \sqrt{ \sum_{i=1}^N \frac{(x_i - y_i^2}{\sigm_i^2} }
> Sacled Euclidean
- Cosine distance : simiarity $= \cos \theta = \frac{A \cdot B}{||A|| ||B||}$
Segmentation as clustering
- K-means clustering based on intensity or clor is essentially vector qunatization of the image attributes.
> Clusters don't have to be spatially coherent.
- Cluster similar pixels (features) together
> Clustering based on (r, g,b,x,y) values enforces more spatial coherence.
K-means for segmentation
- Pros
> Simple and fast
> Converges to a local minimum of the error funtion
> Easy to implement
- Cons
> Memory intensive
> Need to choose K
> Sensitive to initialization
> Sensitive to outliers
- Usage
> Rarely used for pixel segmentation
Mean shift segmenation
- Versatile technique for clustering-based segmentation
- Non-parametric feature-space analysis technique, a so called mode ( the value that appears most often in a set of data values ) seeking algorithm
- Mean shift algorithm seeks modes or local maxima of density in the feature space.
- a procedure for locating the maxima (mode) of a density function given discrete data sampled from that function
- an iterative method, and we start with an initial estimate $x$.
- Let a kernel function $K(x_i - x)$ be given. This function determines the weight of nearby points for re-estimation of the mean. Typically a Gaussian kernel on the distance to the current estimated is used, $K(x_i -x) = e^{-c||x_i-x||^2}$
- The weighted mean of the density in the window determined by is $m(x) = \frac{\sum_{x_i\in N(x)} K(x_i-x)x_i }{\sum_{x_i \in N(x)} K(x_i - x) }$ where $N(x)$ is the neighborhood of $x$.
- The mean-shift algorithm now sets $x \leftarrow m(x)$, and repeats the estimation until $m(x)$ converges.
Kernel density estimation
- Histogram vs Generic KDE
- 비모수적 밀도추정 일반식 $p(x) \approx \frac{k}{NV}$ (V : x 를 둘러싼 영역 $R$ 의 체적 면적, N : 표본의 총수, k : 영역 R 내의 표본의 수)
- 커널 밀도 추정 두가지 방법
> KDE(kernel Density Estimation)
- 체적 V 고정 시키고, 영역내의 표본 수 k가 변하여 밀도 함수 추정
- Parzen window 추정법 (또는 Parzen-Rosenblatt window) 이 대표적 $V_N = \frac{1}{\sqrt{N}}$ 과 같은 $N$ 의 함수로 체적 $V_N$ 지정해 영역 줄여가며 최적밀도 추정
> k-NNR ( Nearest Neighbor Rule) 추정법
- 영역 내 표본 수 k 값을 고정 값으로 선택하고 체적 V 변경시켜 접근
- 어떤 표본점을 포함하는 체적 $k_N = \sqrt{N}$ 개의 표본을 포함하도록 체적 줄여나가면서 최적 밀도 추정
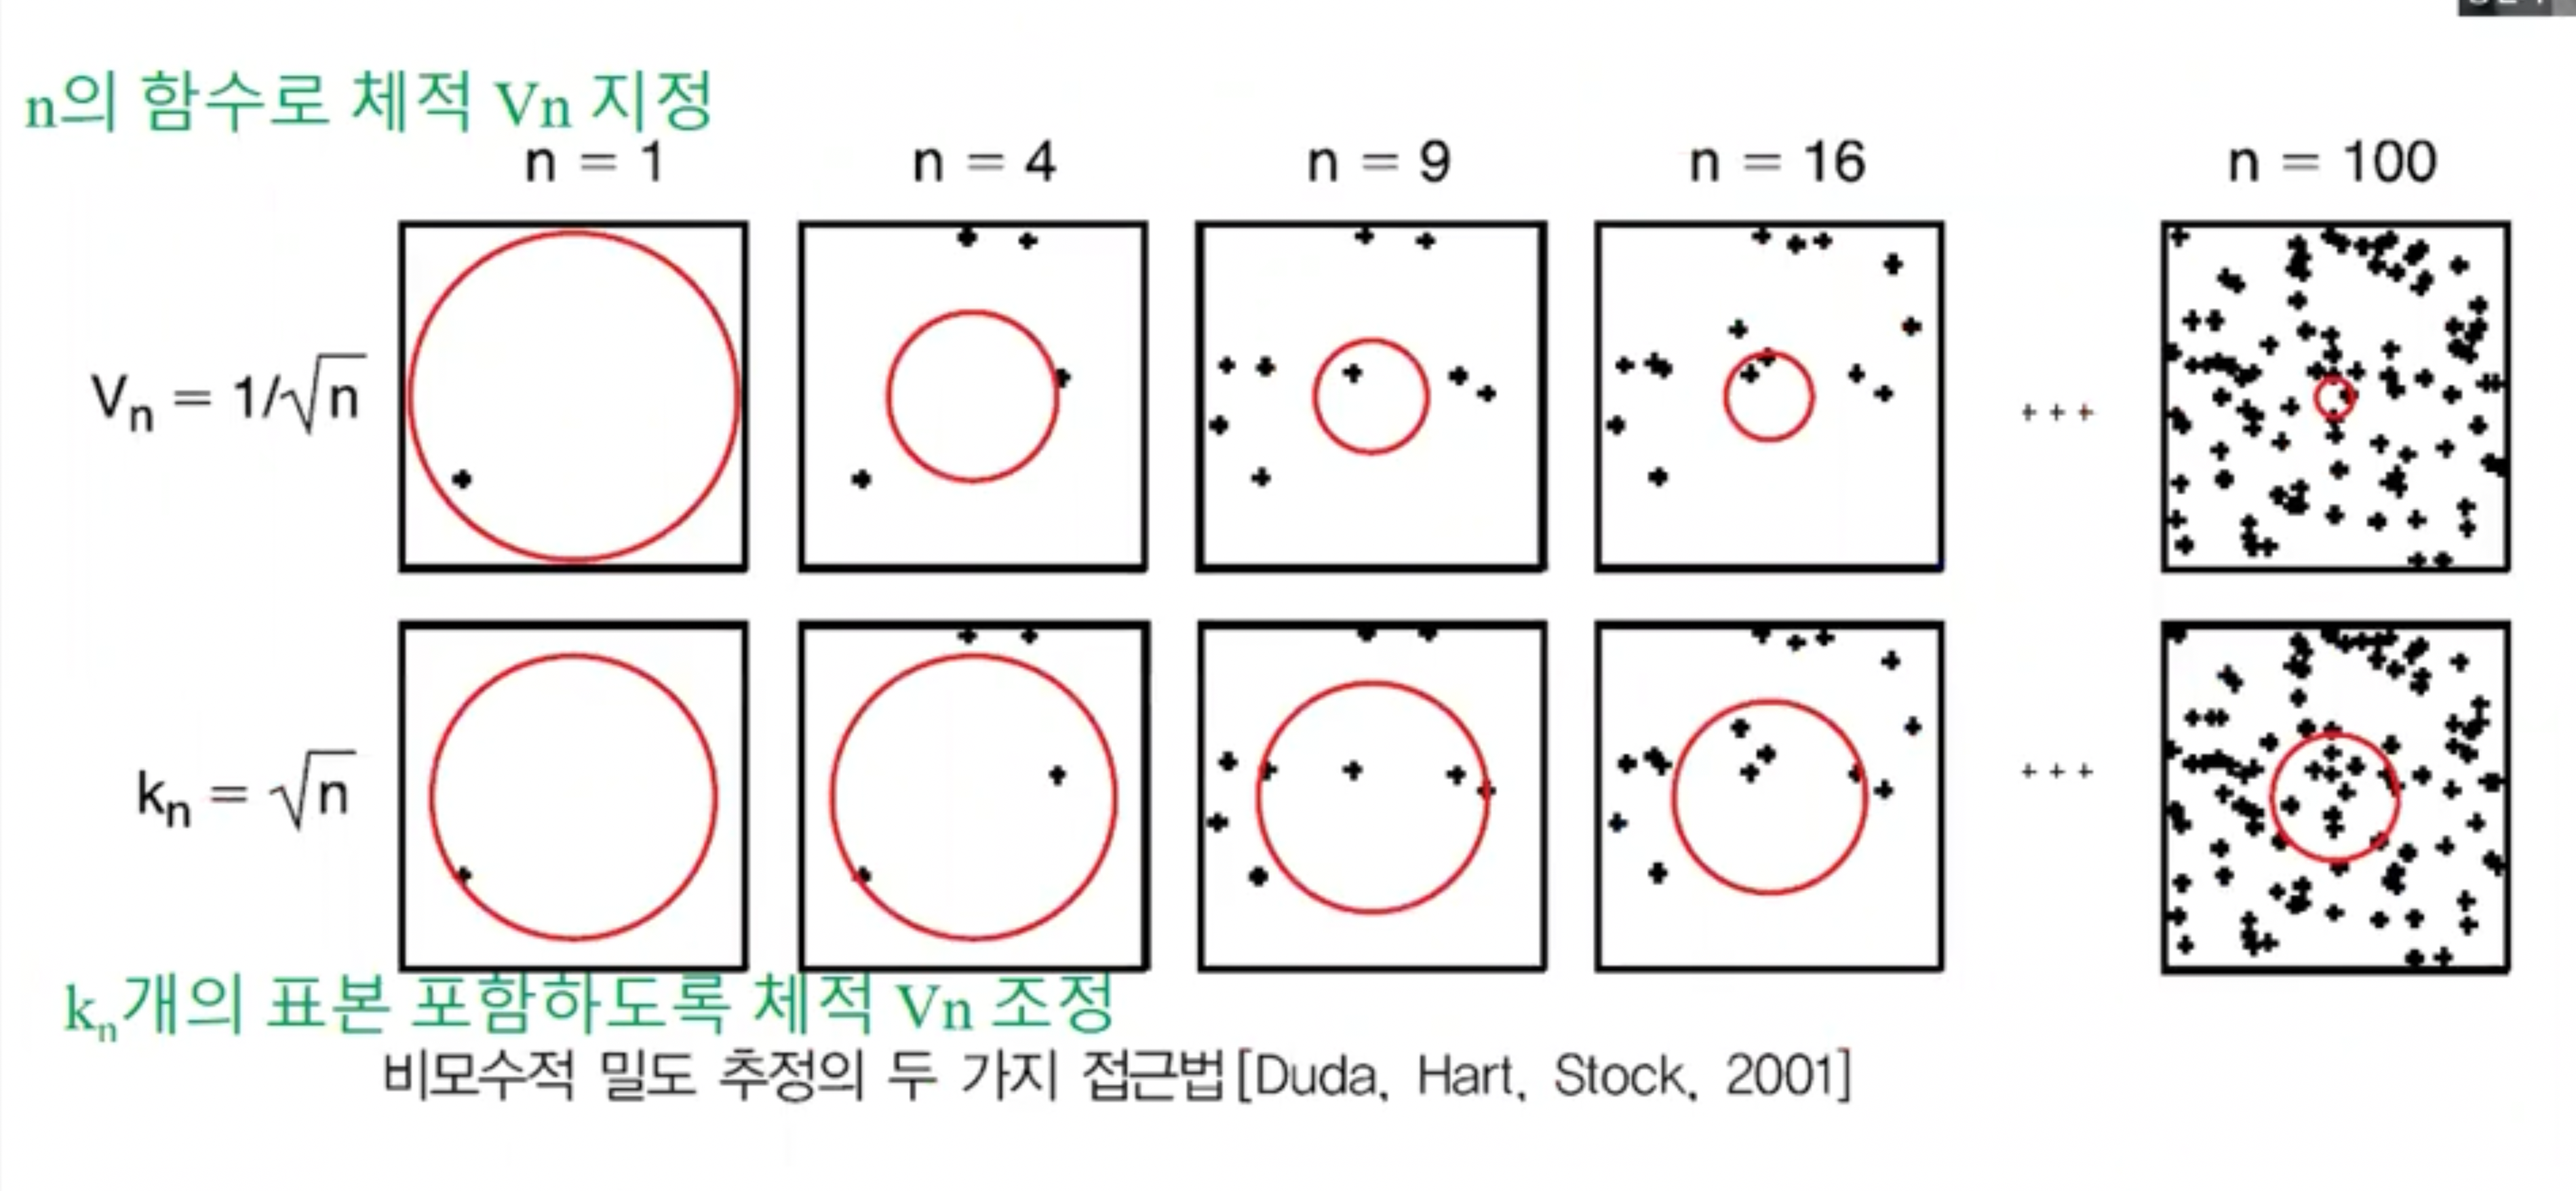
- KDE, K-NNR 모두 N 이 커질수록 실제 확률 밀도에 수렴
- V 와 k 는 N 에 따라 가변적으로 결정됨.
Parzen window based density estimation
- 비모수적 밀도함수 추정 일반식 : V 고정, k 가변 $p(x) \approx \frac{k}{NV}$
- 중심점 x 가 입방체의 중심, 한 변의 길이 h 인 초입방체를 영역 R, 여기에 k 개의 표본을 포함하면 -> 체적 : $V = h^D$
- Parzen window : 최초값이 중심이 되도록 하는 단위 초입방체
- 범위 내에 포함시킬 표본 갯수를 결정할 함수 $K(u) = \left\{\begin{matrix} 1, |u_j| < \frac{1}{2} \\ 0 \end{matrix}\right. $
- 초입방체 내의 점의 총수 : $k = \sum_{n=1}^N K (\frac{x - x^n}{h})$
- Parzen-Rosenblatt window 밀도함수 추정식의 일반화
> 영역 내의 표본의 수는 중심이 x 이고 길이가 h 인 범위 내부에 점 $x^(n)$ 이 속할 때만 1, 나머지는 0
> 영억 $V$ 내에 포함되는 표본의 총 수를 이용해 밀도추정
> 일반적인 커널 밀도함수 추정기 $P_{KDE}(x) = \frac{1}{Nh^D}\sum_{n=1}^N K (\frac{x-x^n}{h})$
- 커널함수의 역할
> $P_{KDE}(x)$ 의 기대값 -> $E[P_{KDE}(x)] = \frac{1}{Nh^D} \sum_{n=1}^N E[K(\frac{x-x^n}{h})] = \frac{1}{h^D}E[K(\frac{x-x^n}{h})] = \frac{1}{h^D}\int K(\frac{x-x^n}{h})p(x')dx'$
> 추정된 밀도 $P_{KDE}(x)$ 의 기대값 : 커널 함수와 실제 밀도함수의 convolution
> 커널의 폭 h 는 스무딩 파라미터 역할
- 커널 함수가 넓을수록 추정치는 더 부드러워짐
- $h \rightarrow 0$ : 커널 함수의 폭 -> 0, 함수값 -> 무한대, 즉 $h \rightarrow 0$ 이면 커널 함수가 delta 함수에 수렴
- 커널함수에서 bandwidth h 의 역할
> $p_n(x) = \frac{1}{Nh^D} \sum_{n=1}^N K(\frac{X-X^n}{h})$
> 커널 함수가 다음의 delta 함수라고 가정하면 $\delta_n(X) = \frac{1}{V_n}K(\frac{X}{h_n} \leftarrow p_n(x) = \frac{1}{n}\sum_{j=1}^n \delta_n(X-X^j)$
- h 커질수록
- delta 함수의 크기 감소
- 동시에 포함되는 표본 데이터 수 증가
- 넓게 퍼진 평활한 형태의 함수
- h 작아질수록
- delta 함수의 크기 증가
- Bandwith 에 포함되는 표본 데이터 수 감소
- 피크 모양에 가까운 형태의 밀도함수
- $y$ 를 $y_0$로 놓고 시작하여 수렴할 때까지 $y_0 \rightarrow y_1 \rightarrow y_2 \cdots$ 반복
> $y_{t+1} = \frac{\sum_{i=1}^n x_k k(\frac{x_i - y_t}{h})}{\sum_{i=1}^n k(\frac{x-i - y_t}{h})}$
> $y_{t+1} = y_t + m(y_t)$ -> $m(y_t)$ 는 벡터
Mean shift clustering
- Attraction basin : the region for which all trajectories lead to the same mode
- Cluster : all data points in the attraction basin of a mode
Mean shift clustering/segmentation
-find features (color, gradients, texture, etc)
- initialize windows at individual feature points
- Perform mean shift for each window until convergence
- Merge windows that end up near the same "peak" or mode
Mean shift clustering
- Teh mean shift algorithm seeks modes of the given set of points
> Choose kernel and bandwidth
> For each point:
- Center a window on the point
- Compute the mean of the data in the search window
- Center the search window at the new mean location
- Repead (b) and (c) until convergence
- Pros
> Good general-purpose segmentation
> Flexible in number and shape of regions
> Robust to outliers
> General mode-finding algorithm (useful for other problems such as finding most common surface normals)
- Cons
> Have to choose kernel size in advance
> Not suitable for high-dimensional features
- When to use it
> Over-segmentation
> Multiple segmentations
> Tracking, clustering, filtering applications
Motion
Uses of motion in computer vision
- 3D shape reconstruction
- object segmentation
- Learning and tracking of dynamical models
- Event and activity recognition
- Self-supervised an predictive learning
Motion field
- The motion field is the projection of the 3D scene motion into the image
Optical flow
- Definition : The apparent motion of brightness patterns in the image
- Ideally, optical flow would be the same as the motion field.
- Have to be careful : apparent motion can be caused by lighting changes without any actual motion
> Think of a uniform rotating sphere under fixed lighting VS a stationary sphere under moving illumination
From images to videos
- A video is a sequence of frames captured over time
- Now our image data is a function of space (x,y) and time(t)
Motion estimation techniques
- Optical flow
> Recover image motion at each pixel from spatio-temporal image brightness variations (optical flow )
- Feature-tracking
> Extract visual features (convers, textured areas) and "track" them over multiple frames
Optical flow
- apparent motion of brightness patterns in the images
- Note : apparent motion can be caused by lighting changes without any actual motion
- Goal : recover image motion at each pixel from potical flow
Estimating Optical flow
- Given two subsequent frames, estimate the apparent motion field u(x,y) and v(x,y) between them

- Key assumptions
> Brightness constancy : projection of the same point looks the same in every frame
> Small motion : points do not move every far
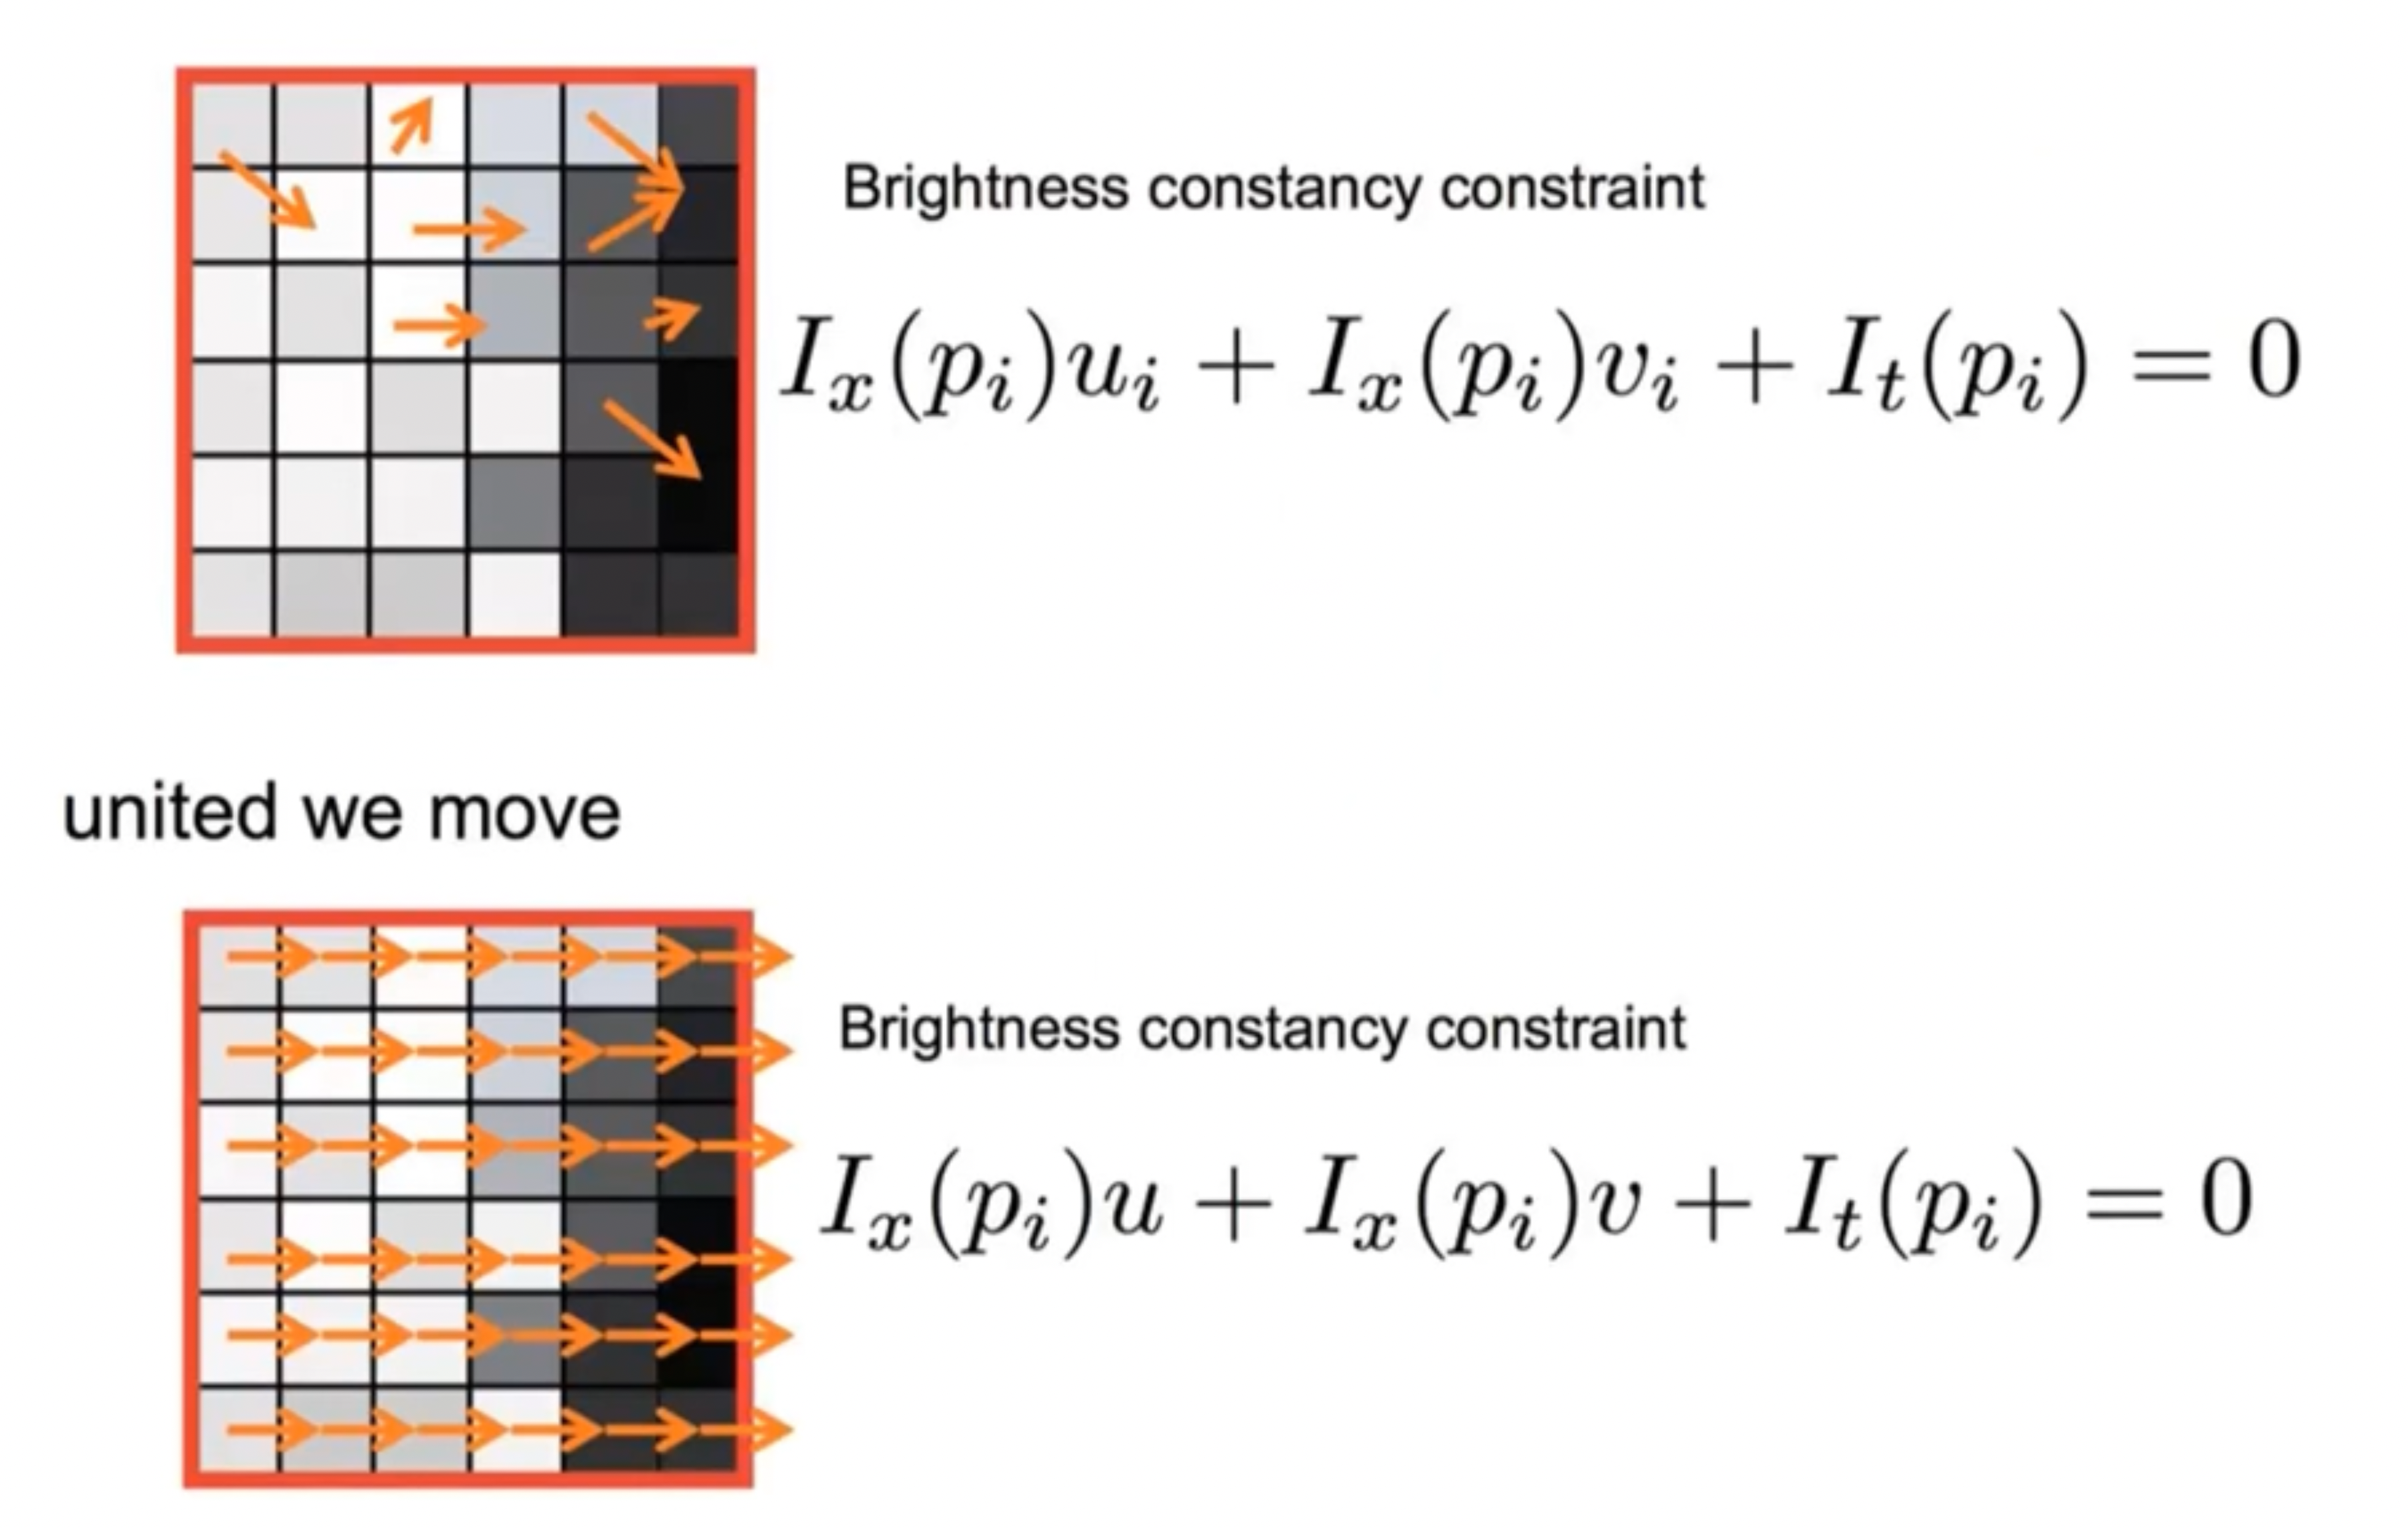
> Spatial coherence : points move like their neighbors
Brightness constancy constraint
- Brightness constancy equation : $I(x,y,t-1) = I(x + u(x,y), y+v(x,y), t)$
- Linearizing the right side using Taylor expansion :
> $I(x+u, y+v, t) \approx I(x,y,t-1) + I_x \cdot u(x,y) + I_y \cdot v(x,y) + I_t$
> $I(x+u, y+v, t) - I(x,y,t-1) = I_x \cdot u(x,y) + I_y \cdot v(x,y) + I_y$
> $I_x \cdot u + I_y \cdot v + I_t \approx 0 \rightarrow \Delta I \cdot [uv]^T + I_t = 0$
* 광류 추정의 원리 *
*- 테일러 급수 이용
* > $f(y+dy, x+dx, t+dt) = f(y,x,t) + \frac{\partial f}{\partial y}dy + \frac{\partial f}{\partial x}dx + \frac{\partial f}{\partial t}dt + $2차 이상의항
* - 두 영상 사이의 시간 차이 $dt$ 가 작다고 가정하고 2차 이상의 항은 무시
*- brightness consistency 가정으로 $f(y+\Delta y, x+\Delta x, t+\Delta t) = f(y,x,t) $ 를 대입하면, $\frac{\partial f}{\partial y}\frac{\partial y}{\partial t} + \frac{\partial f}{\partial x} \frac{\partial x}{\partial t} + \frac{\partial f}{\partial t} = 0$ => 광류 조건식(그레디언트 조건식)
* - $\triangledown f(x,y) = (\frac{\partial f}{\partial x}, \frac{\partial f}{\partial y}) = (d_x, d_y) = (f(y+1, x) - f(y-1,x), f(y, x+1) - f(y, x-1))$
* > $ \frac{\partial y}{\partial t} = v, \frac{\partial x}{\partial t} = u $ : $dt$ 동안 y 와 x 방향으로 이동량. 모션 벡터에 해당
- can we use this equation to recover image motion (u, v) at each pixel? $\triangledown I \cdot [uv]^T + I_y = 0$
- How many equations and unknowns per pixels?
> One equation (this is a scalar equation!), two unknowns (u, v)
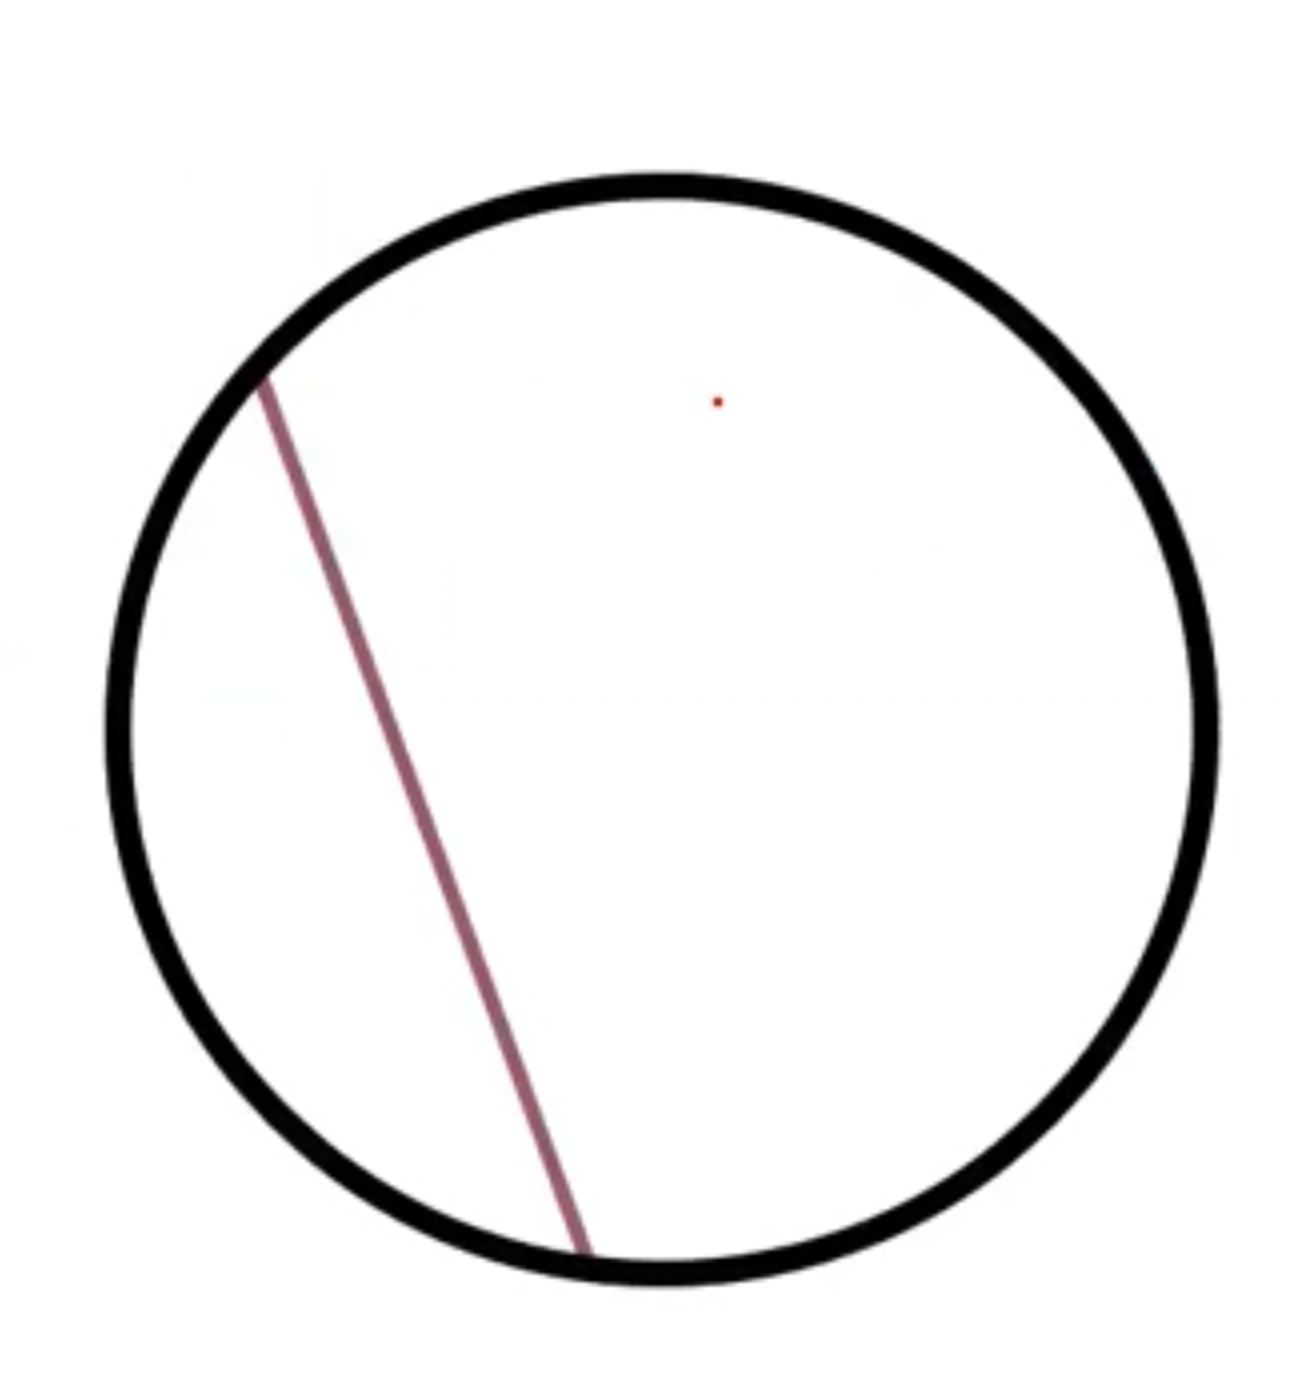
The aperture problem
Actual move $\neq$ Perceived motion
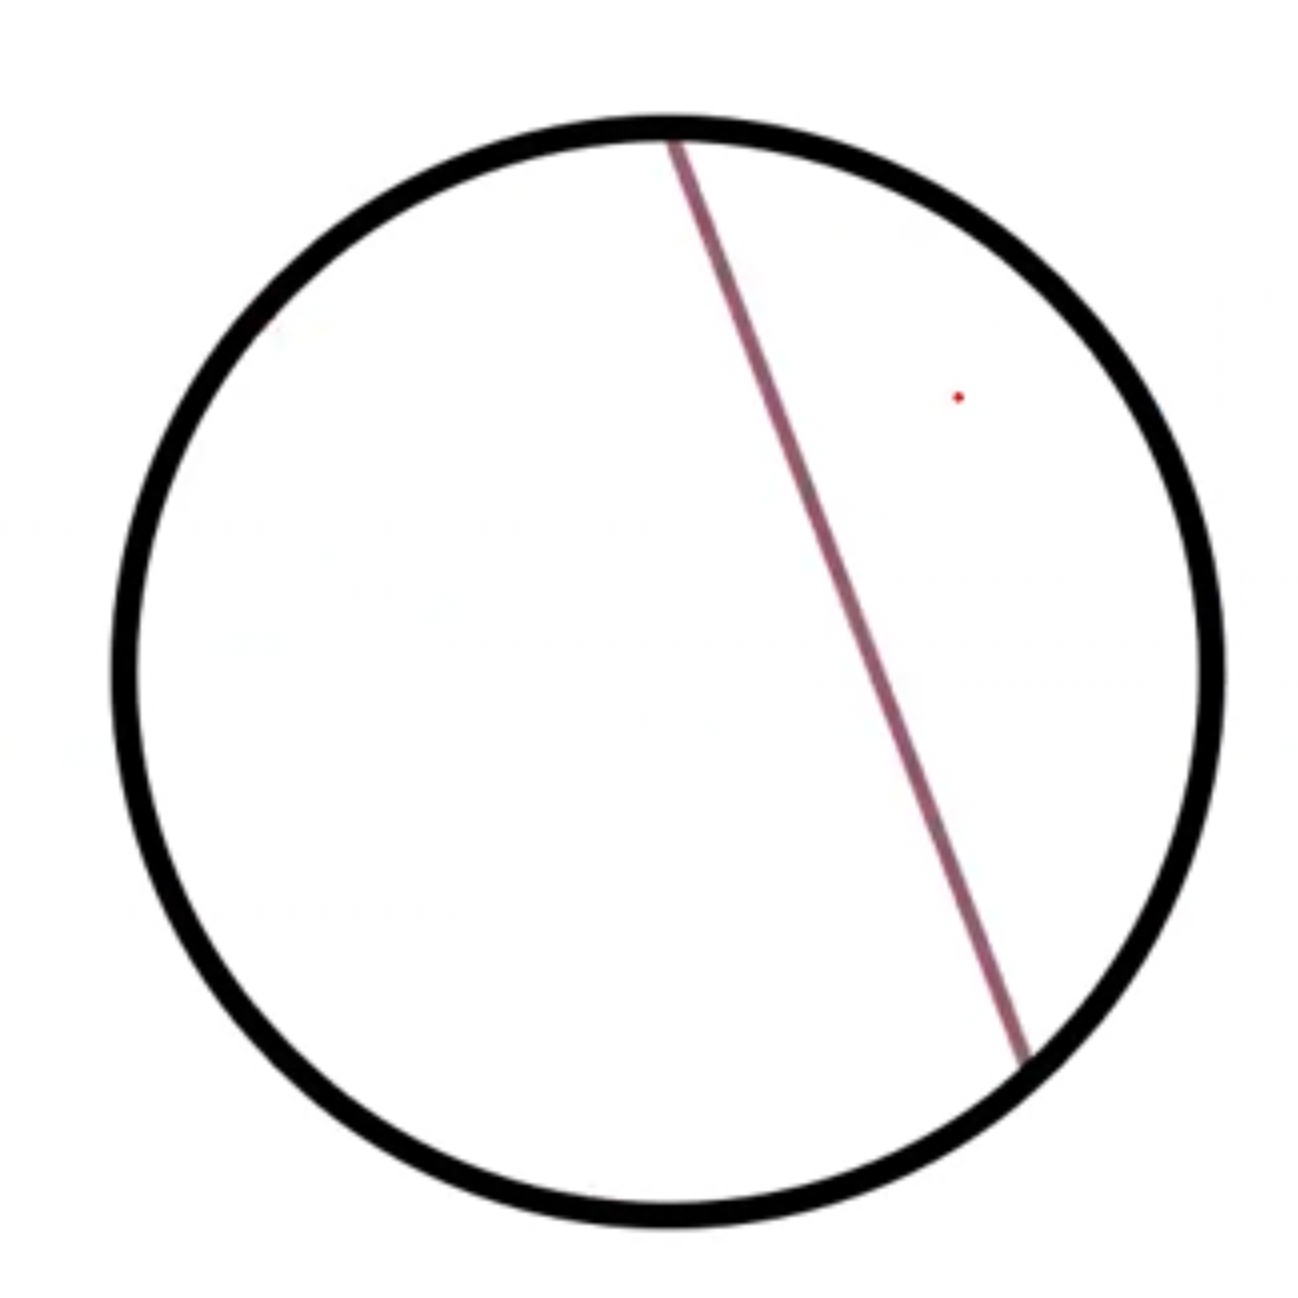
Overcome aperture problem
Optical flow estimation
- Lucas-Kanade
> 화소(y,x) 를 중심으로 하는 윈도우의 영억 N(y,x)의 광류는 같다 라는 가정
> 영역 N(y,x) 의 모둔 화소 $(y_i, x_i)$ 는 같은 모션 벡터(3x3) $v=(v,u)$ 가짐. $\frac{\partial f(y_i, x_i)}{\partial y}v + \frac{\partial f(y_i, x_i)}{\partial x}u + \frac{\partial f(y_i, x_i)}{\partial t} = 0$, $(y_i, x_i) \in N(y,x)$
- 미지수 2개, 식은 $n$ 개-> least square 방법
- 행렬 $A$ 로 표현, $Av^T = b$
> $v^T = (A^TA)^{-1}A^T b$
- 중앙에 가까울수록 가중치 부여 ( 예 : 가우시안 )
> $A^WAv^T = A^TWAb$ -> $v^T = (A^TWA)^{-1}A^TWb$
- Lucas-Kanade
> 이웃 영역만 보는 지역적 알고리즘
- 윈도우 크기 중요 : 클수록 큰 움직임을 추정 가능하지만, 스무딩 효과로 모션 벡터의 정확성 낮아짐
- 해결책으로 피라미드 활용
> 명암 변화가 적은 물체 내부에 0 벡터 발생
'학교수업 > 컴퓨터비전' 카테고리의 다른 글
| [ComputerVision] 11. (0) | 2022.06.02 |
|---|